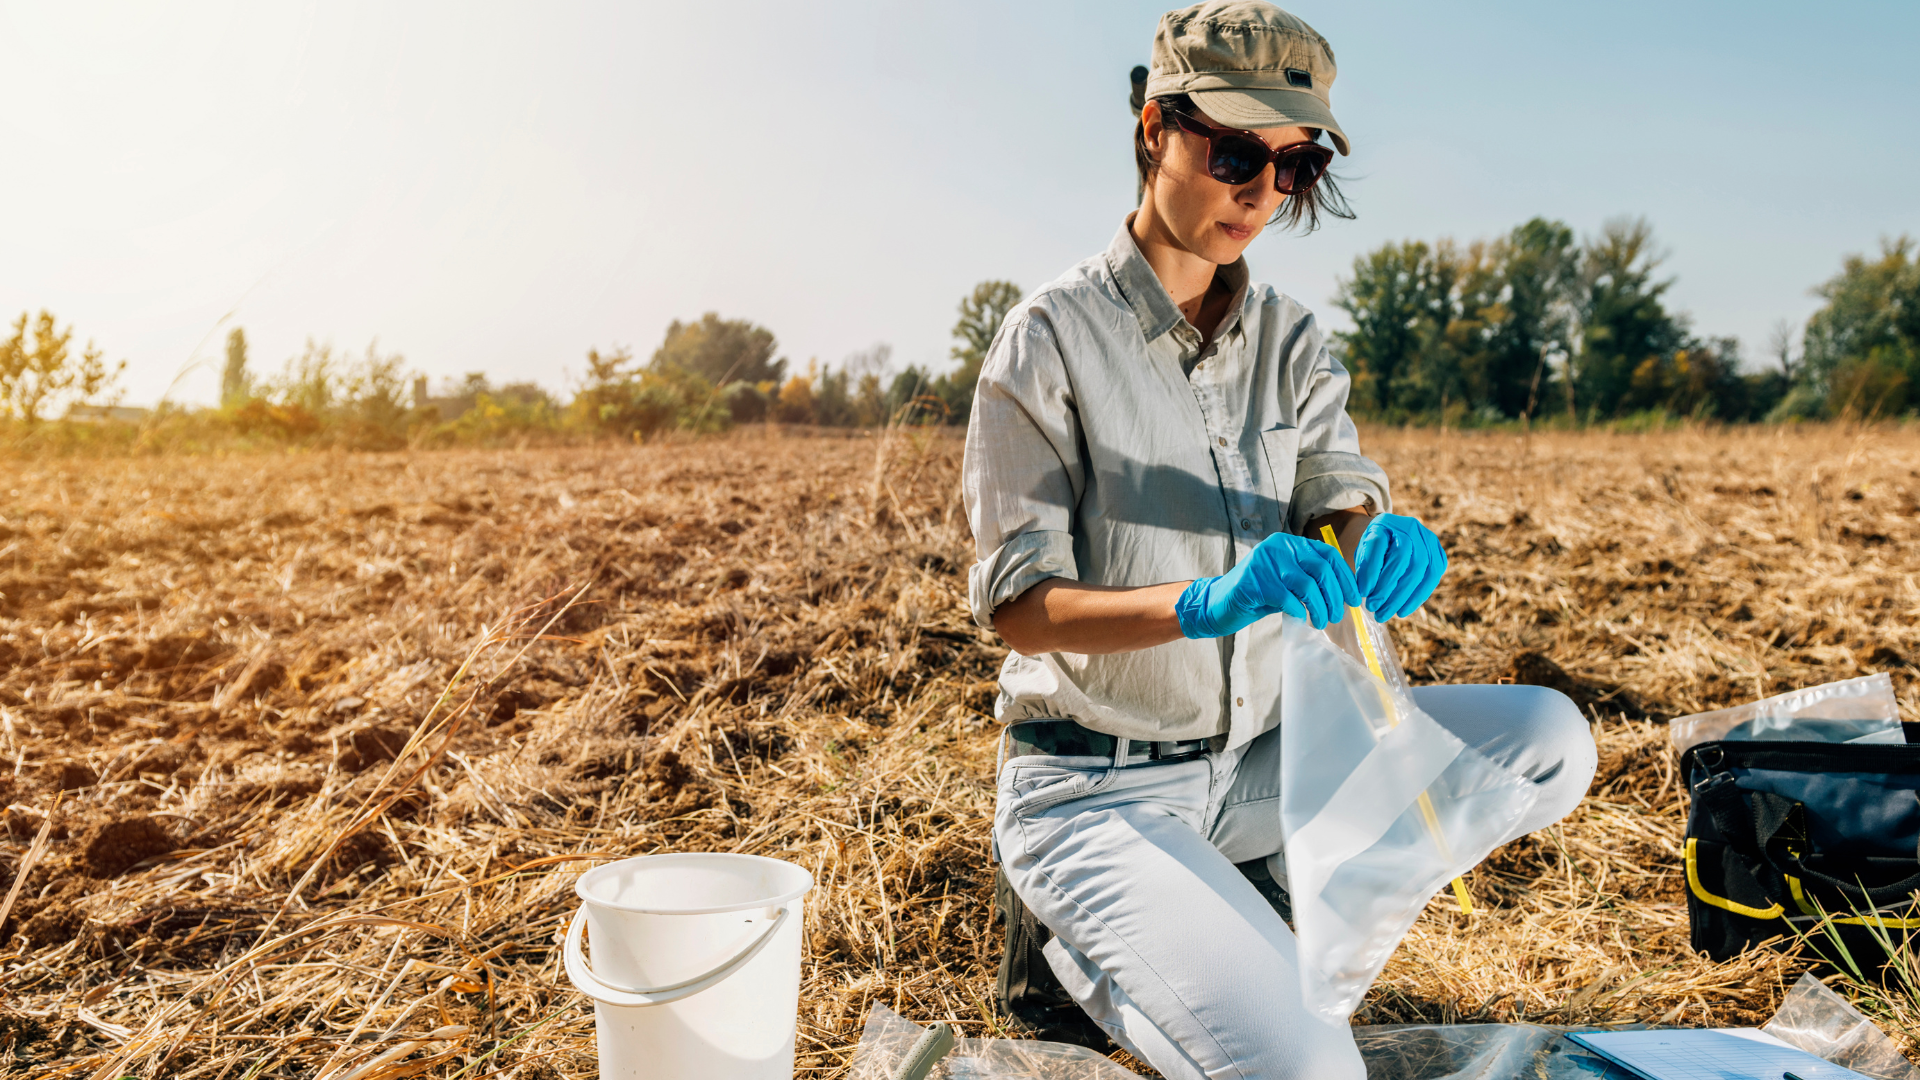
Paper field logs. Hand-written chains of custody. Lab reports matched to samples one by one. Plume maps rebuilt in drafting software. Still doing it all by hand?
Cut soil sampling data admin by up to 50%, from field sample to plume map.
aQRate is soil sampling software for Phase 2 environmental site assessments and delineation programs. Crews capture samples, depths, GPS and field readings offline, lab results link to each sample ID automatically, and exceedance maps and plume views build from the same record.
The problem
Field logs, instrument readings, chains of custody and lab reports each start in a different place.
Answering which samples exceed, where the hot zone is and how big the excavation needs to be means funnelling data into drafting and modeling software.
Every handoff is staff time before the assessment can move forward.
Save time
Up to 50%
less admin time re-typing field notes, writing out chains of custody, matching lab reports to samples and rebuilding maps (internal benchmark; results vary by workflow).
Save money
Hours spent on data handling go back to fieldwork and interpretation.
Improve accuracy
Depth, GPS, field readings and lab results stay on one sample record under one sample ID, and exceedances are flagged against the regulatory guideline you set — such as Alberta Tier 1 — automatically.
How it works
From field sample to remediation zone
Capture in the field
Crews log samples, depths, GPS and field readings in the app, working offline.
One-click chain of custody
Generate the chain of custody from the same records — no second form to fill.
Lab results upload and auto-link
Lab results are linked to each sample ID and its GPS coordinate automatically.
Automatic guideline flagging
Results are compared with the regulatory guideline of your choice — such as the Alberta Tier 1 Soil and Groundwater Remediation Guidelines — set up for the project, and exceedances get red QC tags.
AI-based visualization
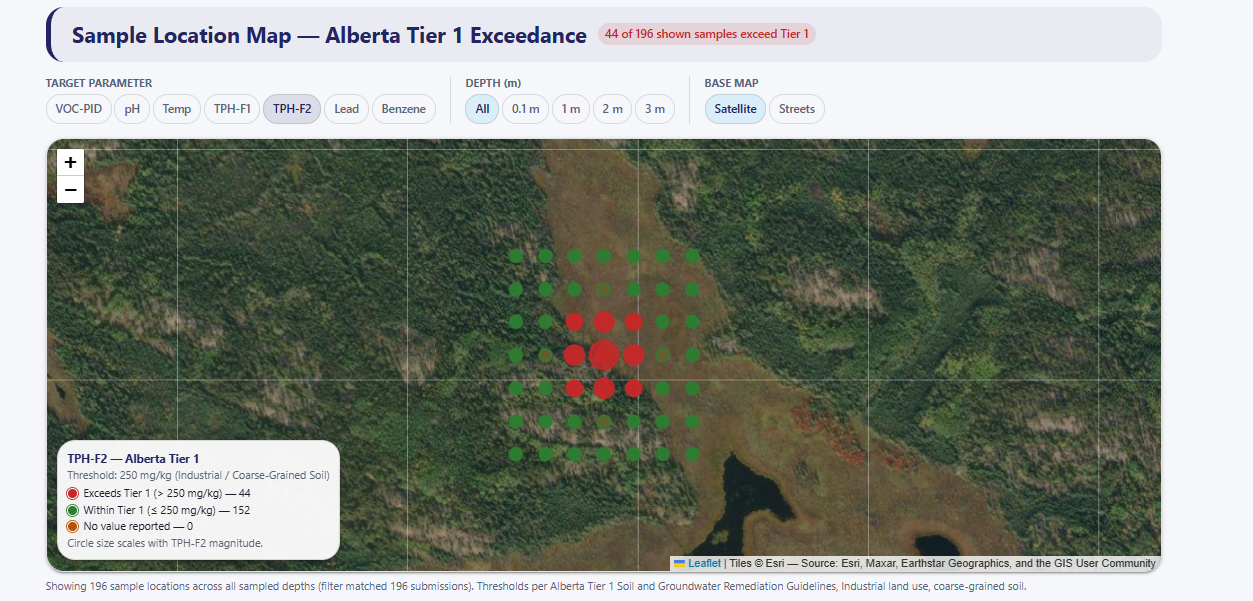
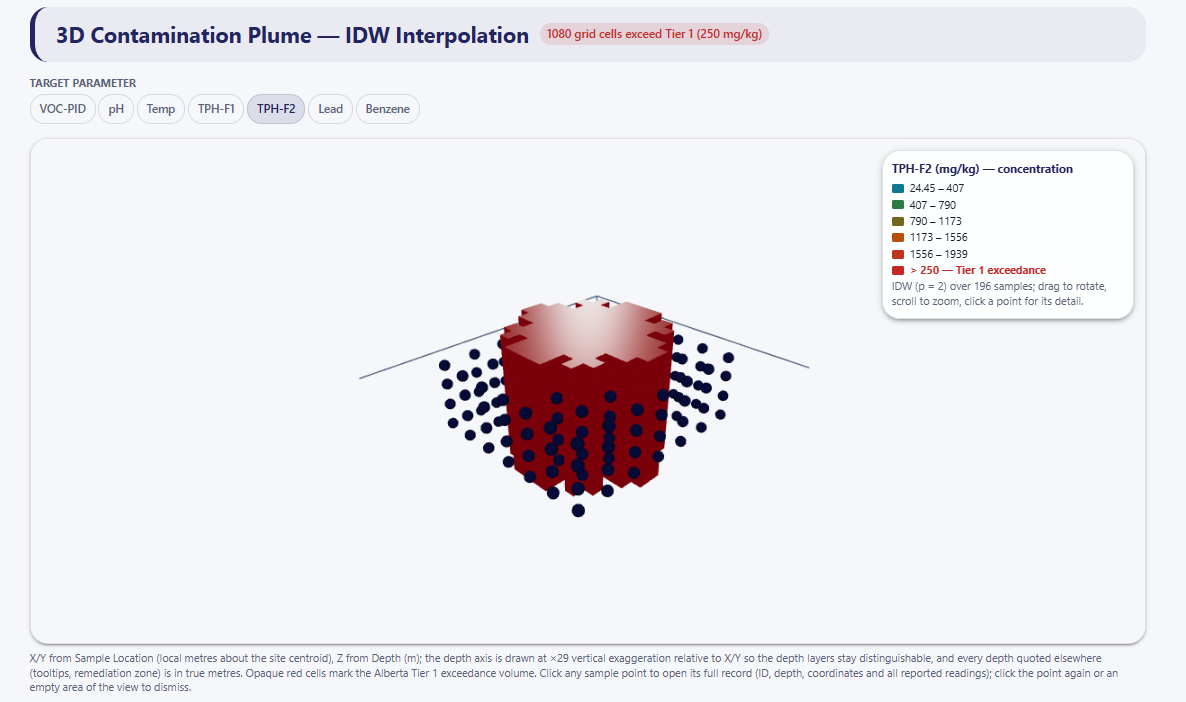
An interactive map and a 3D plume, with 4 contouring methods to delineate the plume. The 3D view is an interpolation (inverse-distance weighting) of sample results — for example petroleum hydrocarbon fractions (PHC F1 to F4).
Remediation zone
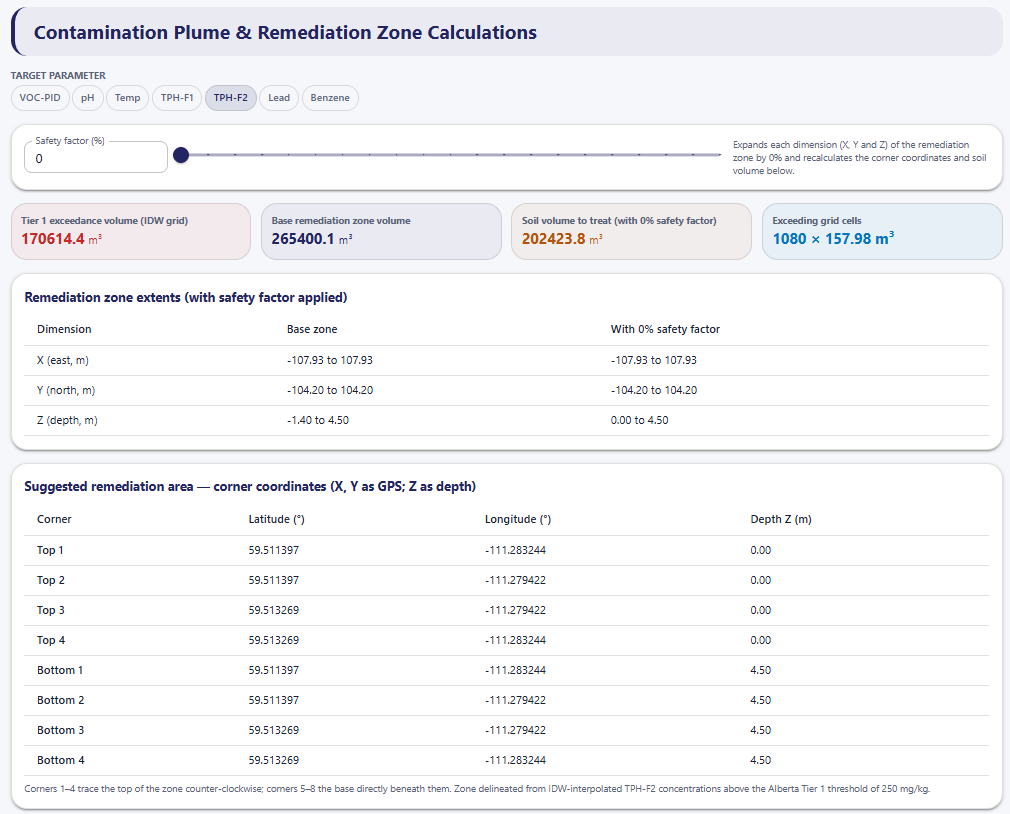
Calculate the hot-zone surface area and the zone's corner coordinates.
The starter template
Built for soil sampling programs, ready to adjust
The Soil Assessment starter template ships with the field form, lab result import and interactive visualizations — watch it build and fill in below.
Soil Assessment Log-Repeated Form
Sample ID*
Sampling Date*
Sampling Time*
Sample Location*
Depth (m)
VOC-PID (ppm)
pH
Temperature (C)
TPH-F1
TPH-F2
Lead
Benzene
Soil Assessment Log-Repeated Form
DELIN-G49-D3.0
2026-08-25T00:00:00.0000000Z
17:16:00
59.51353, -111.27923
3
0.7
6.57
11.5
—
—
—
—
Report ready: Soil Assessment Comprehensive Report
Outcome visuals
See where the contamination is, not just the numbers
Every view below builds from the same sample records — no re-typing into drafting software. Tap any screenshot to enlarge it.
The simulated demo project
One record set, read across depth and in plan
The demo is a simulated Phase 2 environmental site assessment and delineation program at a petroleum hydrocarbon contaminated site. It holds 196 sample records across four depths (0.1, 1, 2 and 3 m) and seven parameters (VOC-PID, pH, temperature, TPH-F1, TPH-F2, lead, benzene). The project and its data are simulated — they represent no real site.
Read the full demo use caseWho it's for
Built first for assessment teams
Environmental consulting firm principals, project managers and field data managers — the people who sign the report and answer for the data behind it.
Phase II and delineation sampling programs
Programs where every sample needs to be locatable, traceable and comparable to guideline values.
Industrial site owners and operators (EHS and remediation leads)
Teams who need a clear picture of a contaminated site before they scope remediation.
Remediation contractors
Crews digging to a zone that carries coordinates and a surface area, not a sketch on paper.
Environmental field technicians
One app for samples, depths, GPS and field readings, with or without signal.
Getting started
From template to first plume map
Create your aQRate workspace in the portal — sign up on aqrate.ca — then follow the sequence below.
Pick the Soil Assessment template
Start from a form built for sampling programs, not a blank page — it can come pre-selected with your workspace.
Adjust the form to your program
Parameters, depths and the regulatory guideline values your project reports against.
Collect in the app
Crews sample offline; records sync when a connection returns.
Link lab results and review the maps
Results attach to sample IDs, and exceedance maps and plume views build from the same records.
Visualize all your data the way you want
Turn the same records into charts, dashboards and shareable links for the team and the report.
FAQ
Questions from assessment teams
How much time and money can this save?
In our internal benchmarks, aQRate cut admin time by up to 50%. Results vary by workflow. Dollar savings depend on your samples per project, team size and labour rates, and we do not publish a dollar figure. A demo can map your current sampling workflow.
What does delineation mean here?
Delineation defines how far contamination extends horizontally and with depth. aQRate helps collect, organize and visualize the sampling data. Deciding whether delineation is complete is a decision for the qualified professional.
Does aQRate decide which guideline applies or whether a site is compliant?
No. aQRate organizes, flags and visualizes sample data. Guideline selection, land use, soil type, remediation scope and regulatory compliance remain with qualified professionals.
How are lab results linked to samples?
Results uploaded from the lab are linked to each sample ID and its GPS coordinate automatically.
What does the guideline check do?
It compares results with the regulatory guideline of your choice — such as the Alberta Tier 1 Soil and Groundwater Remediation Guidelines — set up for the project, and flags exceedances with red QC tags. A qualified professional verifies the applicable guideline and edition.
How accurate are the coordinates?
Coordinates are captured with each sample, and accuracy depends on the device's GPS.
Can crews work offline?
Yes. The iOS and Android apps keep working without signal and sync when a connection returns.